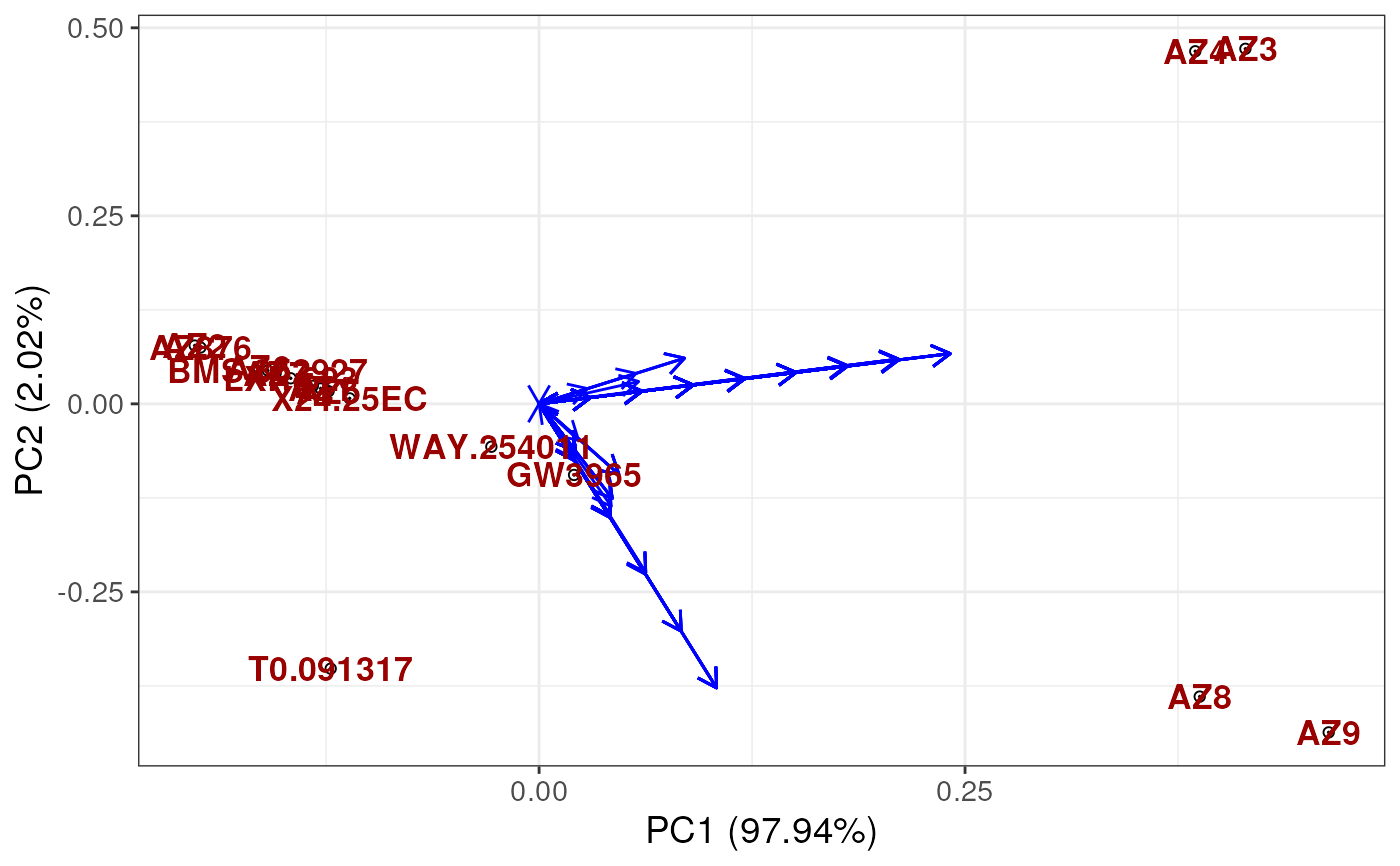
Function to plot the PCA results from the UnsupervisedCSA function
plotUCSA.RdFunction to plot the PCA results from the UnsupervisedCSA function
Arguments
- pca_states
The PCA object from the UnsupervisedCSA function
- states_wide
The values in wide format from the UnsupervisedCSA function
- labels
The labels to use for the plot. Construct labels carefully using example below. The labels should be a data frame with the rownames as the states and the columns as the labels to use for the colouring of the labels.
- pca_params
The parameters to use for the PCA plot. Default is list(x = 1, y = 2, whichlabel = NULL). x indicates principal component to plot on x-axis, y indicates principal component to plot on y-axis. whichlabel indicates the column in the labels to use for the colouring of the labels.
- values
The values to use for the colouring of the labels. Default is
brewer.pal(n = 8, name = "OrRd")[c(8,3)]and "grey" (for unknown labels)
Value
A ggplot object
Examples
library("RexMS")
library(ggfortify)
# Construct labels carefully using known properties of the states (Ligands)

data("out_lxr_compound_proccessed")
data("LXRalpha_compounds")

states <- names(LXRalpha_compounds)

labels <- data.frame(ABCA1 = rep("Unknown", length(states)),
lipogenic = rep("Unknown", length(states)))
rownames(labels) <- states

labels$ABCA1[rownames(labels) %in% c("LXR.623", "AZ9", "AZ8", "AZ5")] <- "low"
labels$ABCA1[rownames(labels) %in% c("Az1", "AZ2", "AZ3", "AZ4", "AZ6",
                                    "AZ7", "AZ876", "T0.901317", "WAY.254011",
                                    "F1", "GW3965", "BMS.852927")] <- "high"


labels$lipogenic[rownames(labels) %in% c("AZ6", "AZ7", "AZ9",
                                        "AZ8", "GW3965", "BMS.852927",
                                        "LXR.623")] <- "Non-Lipogenic"

labels$lipogenic[rownames(labels) %in% c("AZ876", "AZ1",
                                        "T0.901317", "F1", "WAY.254011")] <- "Lipogenic"

labels$ABCA1 <- factor(labels$ABCA1,
                       levels = c("low", "high", "Unknown"))
labels$lipogenic <- factor(labels$lipogenic,
                          levels = c("Non-Lipogenic", "Lipogenic", "Unknown"))


ucsa <- UnsupervisedCSA(out_lxr_compound_proccessed,
                       quantity = "TRE",
                       states = states,
                       whichTimepoint = 600,
                       pca_params = list(scale = FALSE,
                                         center = TRUE))


plotUCSA(pca_states = ucsa$pca_states,
         states_wide = ucsa$states_wide,
         labels = labels)