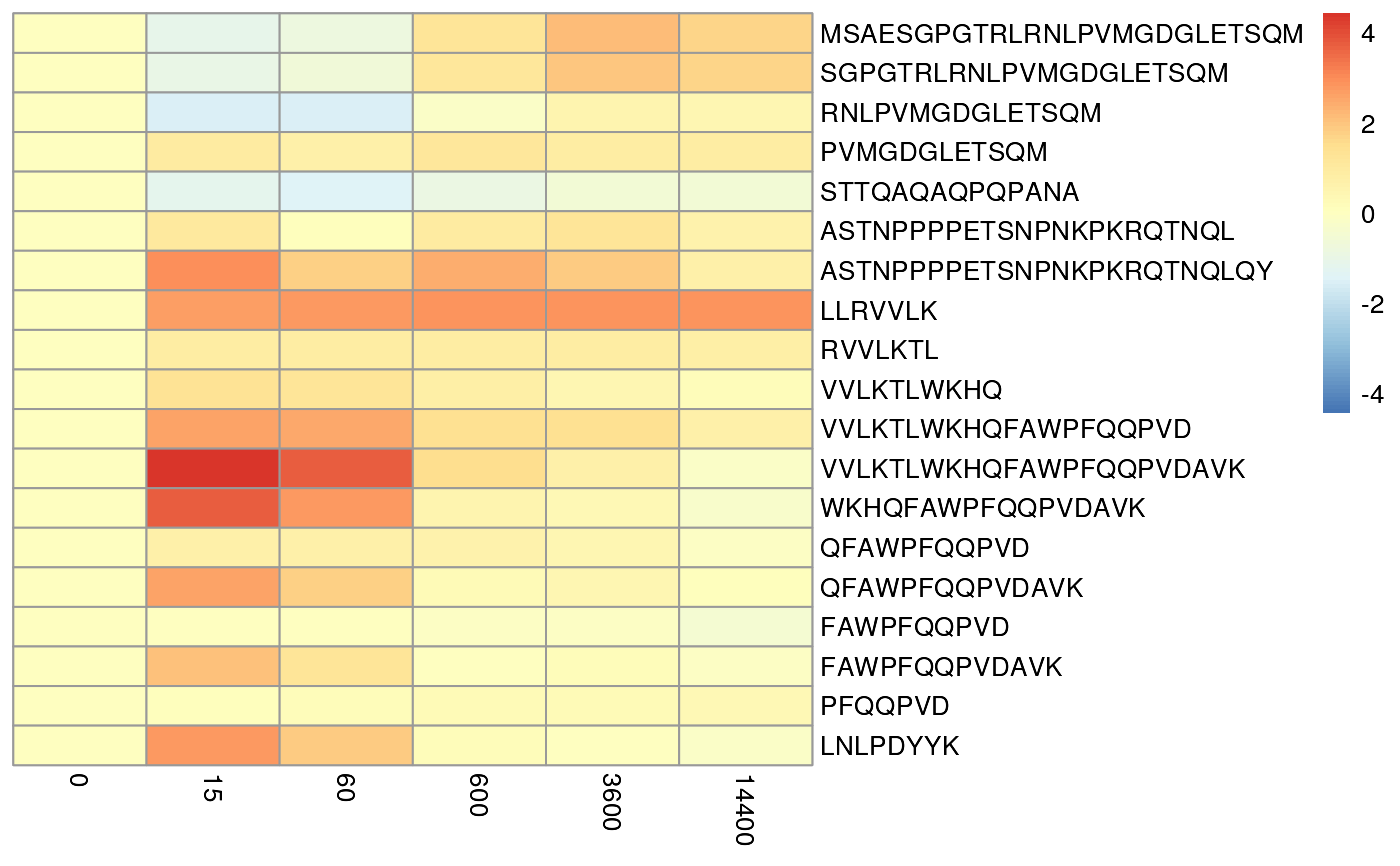
Plot Peptide level error rates
plotPeptideError.RdPlot Peptide level error rates
plotPeptideError(rex_params, HdxData, relative = FALSE)Arguments
- rex_params
An object of class RexParams
- HdxData
An object of class DataFrame, containing the HDX-MS data used.
- relative
Logical, if TRUE the error rates are normalised by the maximum uptake
Value
Returns a pheatmap object
Examples
require(RexMS)
require(dplyr)

data("BRD4_apo")

BRD4_apo <- BRD4_apo %>% filter(End < 100)
numTimepoints <- length(unique(BRD4_apo$Exposure))
Timepoints <- unique(BRD4_apo$Exposure)
numPeptides <- length(unique(BRD4_apo$Sequence))

rex_test <- rex(HdxData = DataFrame(BRD4_apo),
              numIter = 10,
              R = max(BRD4_apo$End),
              numtimepoints = numTimepoints,
              timepoints = Timepoints,
              seed = 1L,
              tCoef = c(0, rep(1, 5)),
              BPPARAM = SerialParam())
#> Fold 1 ... Fold 2 ... Fold 3 ... Fold 4 ... Fold 5 ...
#>
  |
  |                                                                      |   0%
#> Fold 1 ... Fold 2 ... Fold 3 ... Fold 4 ... Fold 5 ...
#>
  |
  |                                                                      |   0%

rex_test <- RexProcess(HdxData = DataFrame(BRD4_apo),
                    params = rex_test,
                    range = 5:10,
                    thin = 1, whichChains = c(1,2))

plotPeptideError(rex_params = rex_test, HdxData = DataFrame(BRD4_apo))