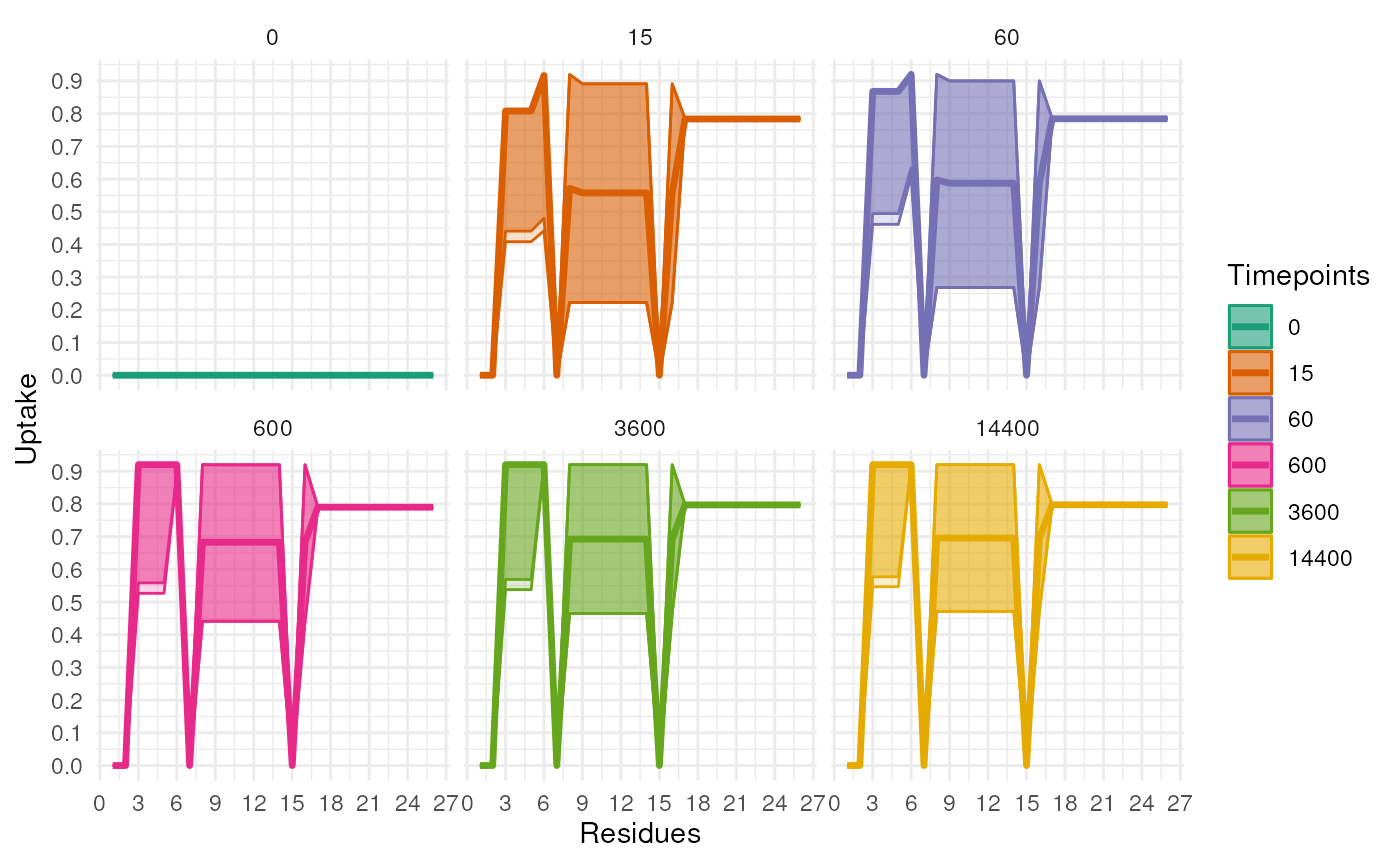
Function to plot the uncertainty of the Uptake
plotUptakeUncertainty.RdFunction to plot the uncertainty of the Uptake
plotUptakeUncertainty(
  samples,
  quantiles = c(0.025, 0.05, 0.5, 0.95, 0.975),
  values = brewer.pal(9, "Dark2"),
  nrow = 2
)
Arguments
- samples
An object of class DataFrame containing the samples of the Uptake
- quantiles
A numeric vector of quantiles to calculate. Default is c(0.025, 0.05, 0.5, 0.95, 0.975)
- values
A vector of colours to use in the plot of timepoints
- nrow
An integer value indicating the number of rows in the facet.
Value
Returns a ggplot object
Examples
require(RexMS)
require(dplyr)
data("BRD4_apo")
BRD4_apo <- BRD4_apo %>% filter(End < 40)

numTimepoints <- length(unique(BRD4_apo$Exposure))
Timepoints <- unique(BRD4_apo$Exposure)

rex_example <- rex(HdxData = DataFrame(BRD4_apo),
                numIter = 4, # typically much larger
                R = max(BRD4_apo$End),
                numtimepoints = numTimepoints,
                timepoints = Timepoints,
                seed = 1L,
                numChains = 1L,
                tCoef = c(0, rep(1, 5)),
                BPPARAM = SerialParam())
#> Fold 1 ... Fold 2 ... Fold 3 ... Fold 4 ... Fold 5 ...
#>
  |
  |                                                                      |   0%
rex_example <- RexProcess(HdxData = DataFrame(BRD4_apo),
                          params = rex_example,
                          thin = 1,
                          range = 1:4,
                          whichChains = c(1))
samples <- marginalEffect(rex_example, range = 1:4)
plotUptakeUncertainty(samples)
#> Warning: n too large, allowed maximum for palette Dark2 is 8
#> Returning the palette you asked for with that many colors